# find the longest consecutive string of successful pings longest_streak = 1 current_streak = 1
for i inrange(1, len(icmp_seq_numbers)): if icmp_seq_numbers[i] == icmp_seq_numbers[i - 1] + 1: current_streak += 1 else: longest_streak = max(longest_streak, current_streak) current_streak = 1# Reset for the next potential sequence
print(f"Length of the longest consecutive sequence: {longest_streak}")
# Find the length of the longest consecutive missing sequence missing_seq_numbers = sorted(expected_seq_numbers - set(icmp_seq_numbers)) longest_missing_streak = 0 current_streak = 0
for i inrange(1, len(missing_seq_numbers)): if missing_seq_numbers[i] == missing_seq_numbers[i - 1] + 1: current_streak += 1 else: longest_missing_streak = max(longest_missing_streak, current_streak + 1) # +1 to count the first missing number current_streak = 0
print(f"Length of the longest consecutive missing sequence: {longest_missing_streak}")
# Compute the independent or correlated of "packet losses" received_replies = set(icmp_seq_numbers)
successful_n = 0 successful_n_plus_1 = 0
for n inrange(min(received_replies), max(received_replies)): if n in received_replies: successful_n += 1 if n + 1in received_replies: successful_n_plus_1 += 1
if successful_n > 0: probability = successful_n_plus_1 / successful_n else: probability = 0.0
print(f"Probability that echo request seqno #(N+1) was replied to given seqno #N was replied to: {probability:.2f}")
unsuccessful_n = 0 successful_n_plus_1 = 0
for n inrange(min(received_replies), max(received_replies)): if n notin received_replies: unsuccessful_n += 1 if (n + 1) in received_replies: successful_n_plus_1 += 1
if unsuccessful_n > 0: probability = successful_n_plus_1 / unsuccessful_n else: probability = 0.0
print(f"Probability that echo request seqno #(N+1) was replied to given seqno #N did not receive a reply: {probability:.2f}")
# RTT rtt_values = re.findall(r'time=(\d+\.?\d*) ms', data) rtt_values = list(map(float, rtt_values)) min_rtt = min(rtt_values) max_rtt = max(rtt_values) print(f"Minimum RTT seen over the entire interval: {min_rtt:.2f} ms") print(f"Maximum RTT seen over the entire interval: {max_rtt:.2f} ms")
测试的结果:
1
2
3
4
5
6
7
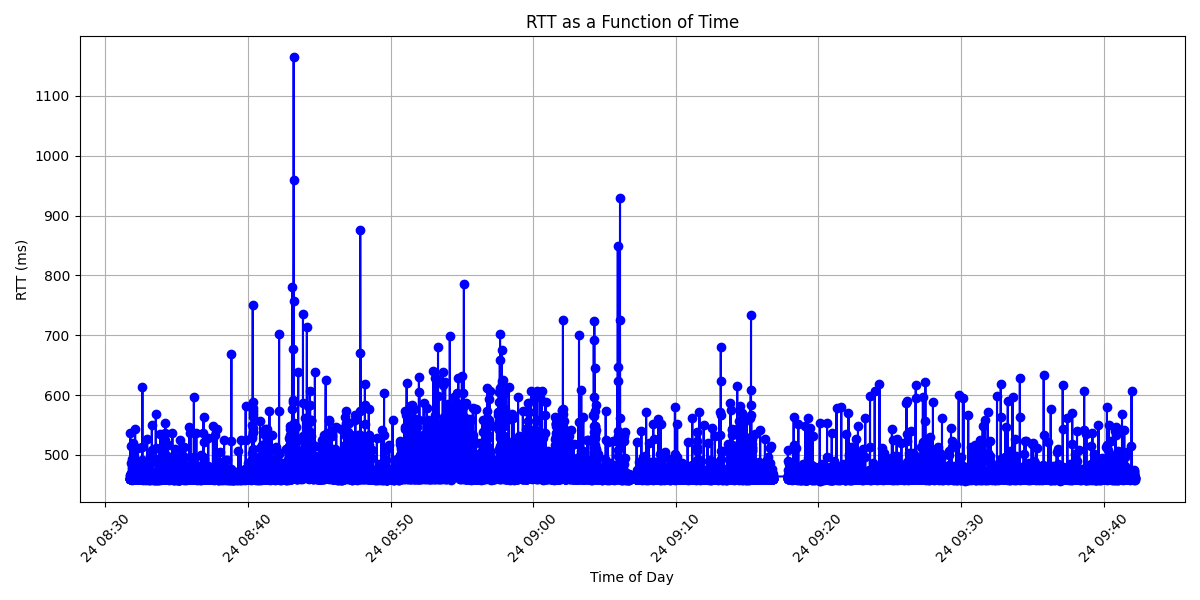
overall delivery date: 0.958145555662096
Length of the longest consecutive sequence: 311
Length of the longest consecutive missing sequence: 300
Probability that echo request seqno #(N+1) was replied to given seqno #N was replied to: 0.98
Probability that echo request seqno #(N+1) was replied to given seqno #N did not receive a reply: 0.41
Minimum RTT seen over the entire interval: 457.00 ms
Maximum RTT seen over the entire interval: 1164.00 ms
import re import matplotlib.pyplot as plt import pandas as pd
# Read the data from the file withopen('data.txt', 'r') as file: data = file.read()
# Extract RTT values and timestamps using regular expressions timestamps = re.findall(r'\[(\d+\.\d+)\] 64 bytes', data) rtt_values = re.findall(r'time=(\d+\.?\d*) ms', data)
# Convert RTT values to float rtt_values = list(map(float, rtt_values))
# Convert timestamps to datetime format timestamps = [pd.to_datetime(float(ts), unit='s', origin='unix') for ts in timestamps]
# Create a DataFrame for easier plotting df = pd.DataFrame({'Time': timestamps, 'RTT': rtt_values})
# Plotting plt.figure(figsize=(12, 6)) plt.plot(df['Time'], df['RTT'], marker='o', linestyle='-', color='b') plt.title('RTT as a Function of Time') plt.xlabel('Time of Day') plt.ylabel('RTT (ms)') plt.xticks(rotation=45) plt.grid()
import re import matplotlib.pyplot as plt import numpy as np
# Read the data from the file withopen('data.txt', 'r') as file: data = file.read()
# Extract RTT values using regular expressions rtt_values = re.findall(r'time=(\d+\.?\d*) ms', data) rtt_values = list(map(float, rtt_values)) # Convert to float
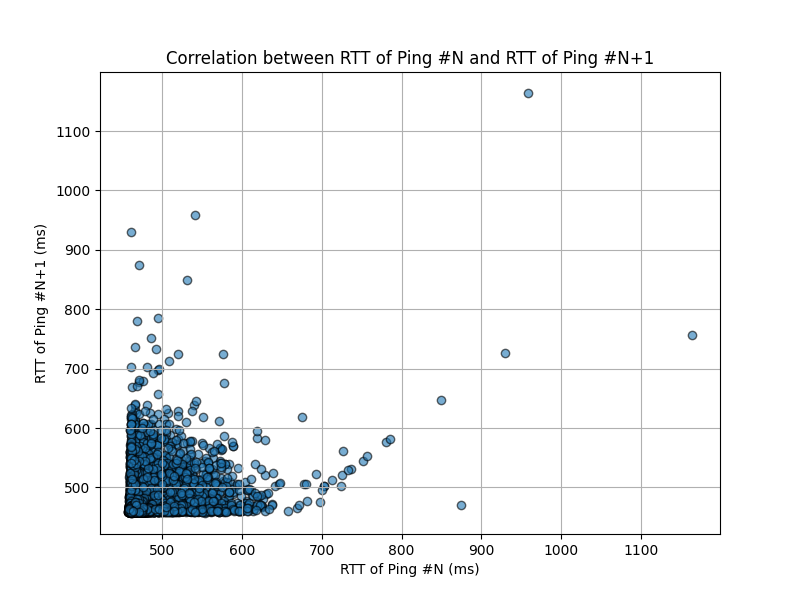
# Create pairs of consecutive RTT values (N and N+1) iflen(rtt_values) < 2: print("Not enough RTT values for correlation analysis.") else: rtt_N = rtt_values[:-1] # RTT of ping #N rtt_N_plus_1 = rtt_values[1:] # RTT of ping #N+1
# Plot RTT of ping #N vs RTT of ping #N+1 plt.figure(figsize=(8, 6)) plt.scatter(rtt_N, rtt_N_plus_1, alpha=0.6, edgecolors='black') plt.title('Correlation between RTT of Ping #N and RTT of Ping #N+1') plt.xlabel('RTT of Ping #N (ms)') plt.ylabel('RTT of Ping #N+1 (ms)') plt.grid(True) plt.show()